Case Study
Licensing
Turning a vague 'merge two admin platforms' mandate into a research-grounded, unified Partner Dashboard — defining the information architecture, data model, and UX strategy for WebPros' consolidated licensing experience.
Role
Lead UX Designer
Timeline
Ongoing
Tools
Figma, Confluence, Jira, Miro
Overview
WebPros needed to consolidate three legacy licensing platforms — Manage2 (M2), Key Administrator (KA), and KA Partner Central (KAPC) — into a single, modern Partner Dashboard. Each system had its own data model, user roles, naming conventions, and feature set, creating confusion for partners and internal teams alike. I owned the end-to-end UX strategy: framing the problem, running deep research, mapping jobs across systems, normalizing the data model, defining the permissions framework, and driving the unified UI specification.
Framing the Problem
The 'merge M2 and KA' goal had been floating around without a clear owner or concrete plan. I authored the master UX brief that connected to a network of related documents — consolidation cases, billing proposals, partner lifecycle maps, system data flows, and JTBD scenarios — giving the organization a single source of truth to align around.
By defining the problem statement, audience, and scope up front, I transformed an ambiguous initiative into a structured, research-grounded UX project with clear deliverables feeding into the official Partner Dashboard Project Charter.
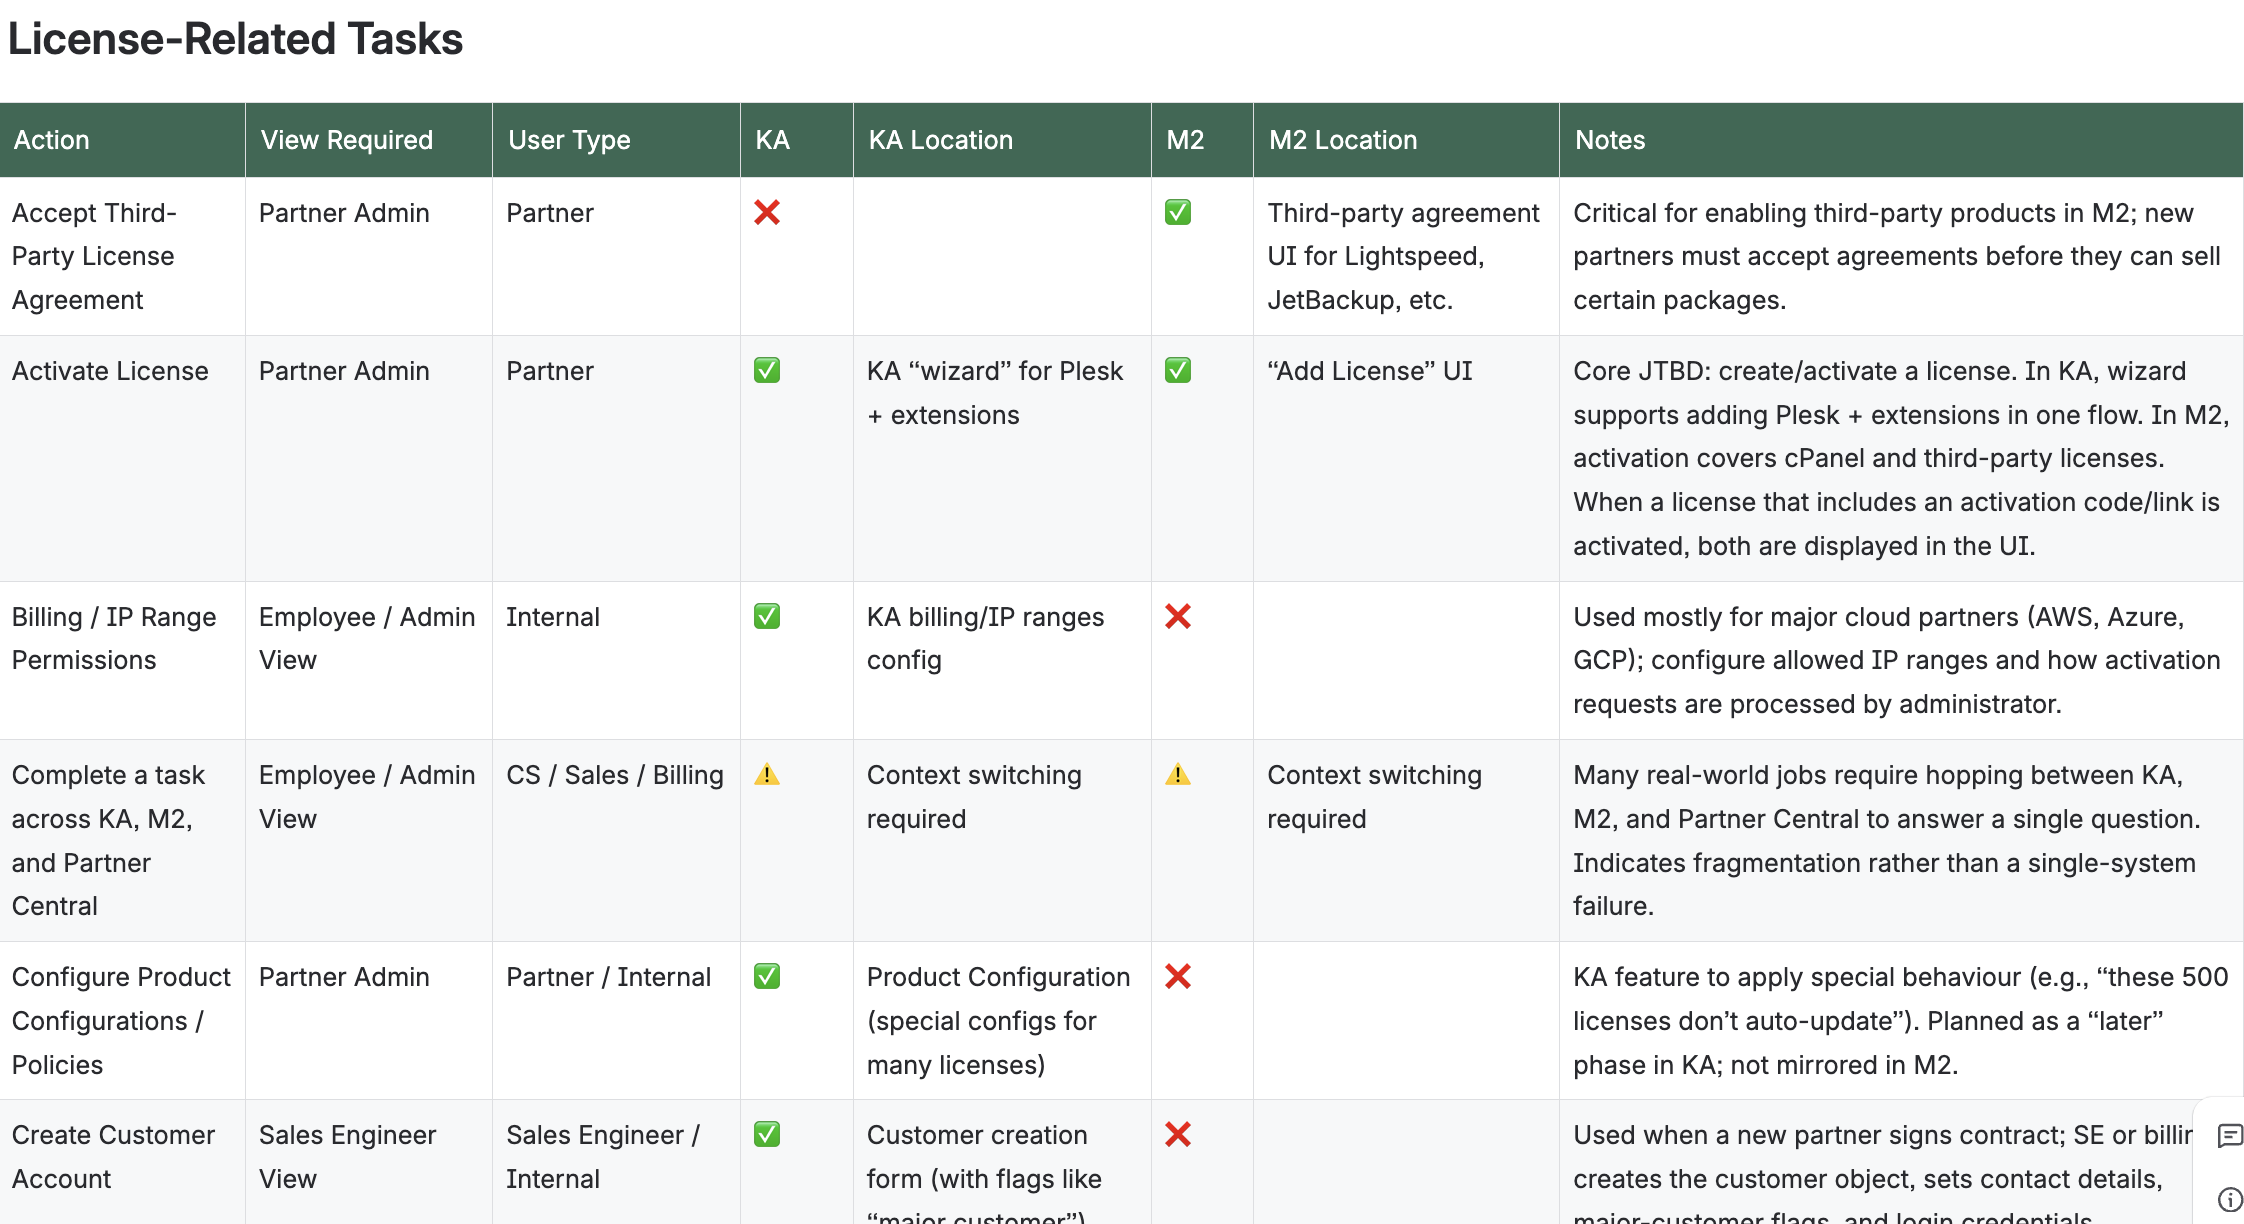
Cross-System Jobs & Flow Mapping
I built comprehensive JTBD and task inventories across all three platforms. For every license-related task — from accepting third-party agreements to bulk license changes — I documented the action, required view, user type, where it lives in KA versus M2, and behavioral gaps between systems.
A master jobs list tagged each task with IDs, grouped them by theme (billing, reporting, bulk operations), and highlighted gaps the unified dashboard needed to close, such as cross-system search and license discovery. This work became the backbone of the Partner Dashboard information architecture, ensuring the new UI is driven by real jobs — not just ported screens.
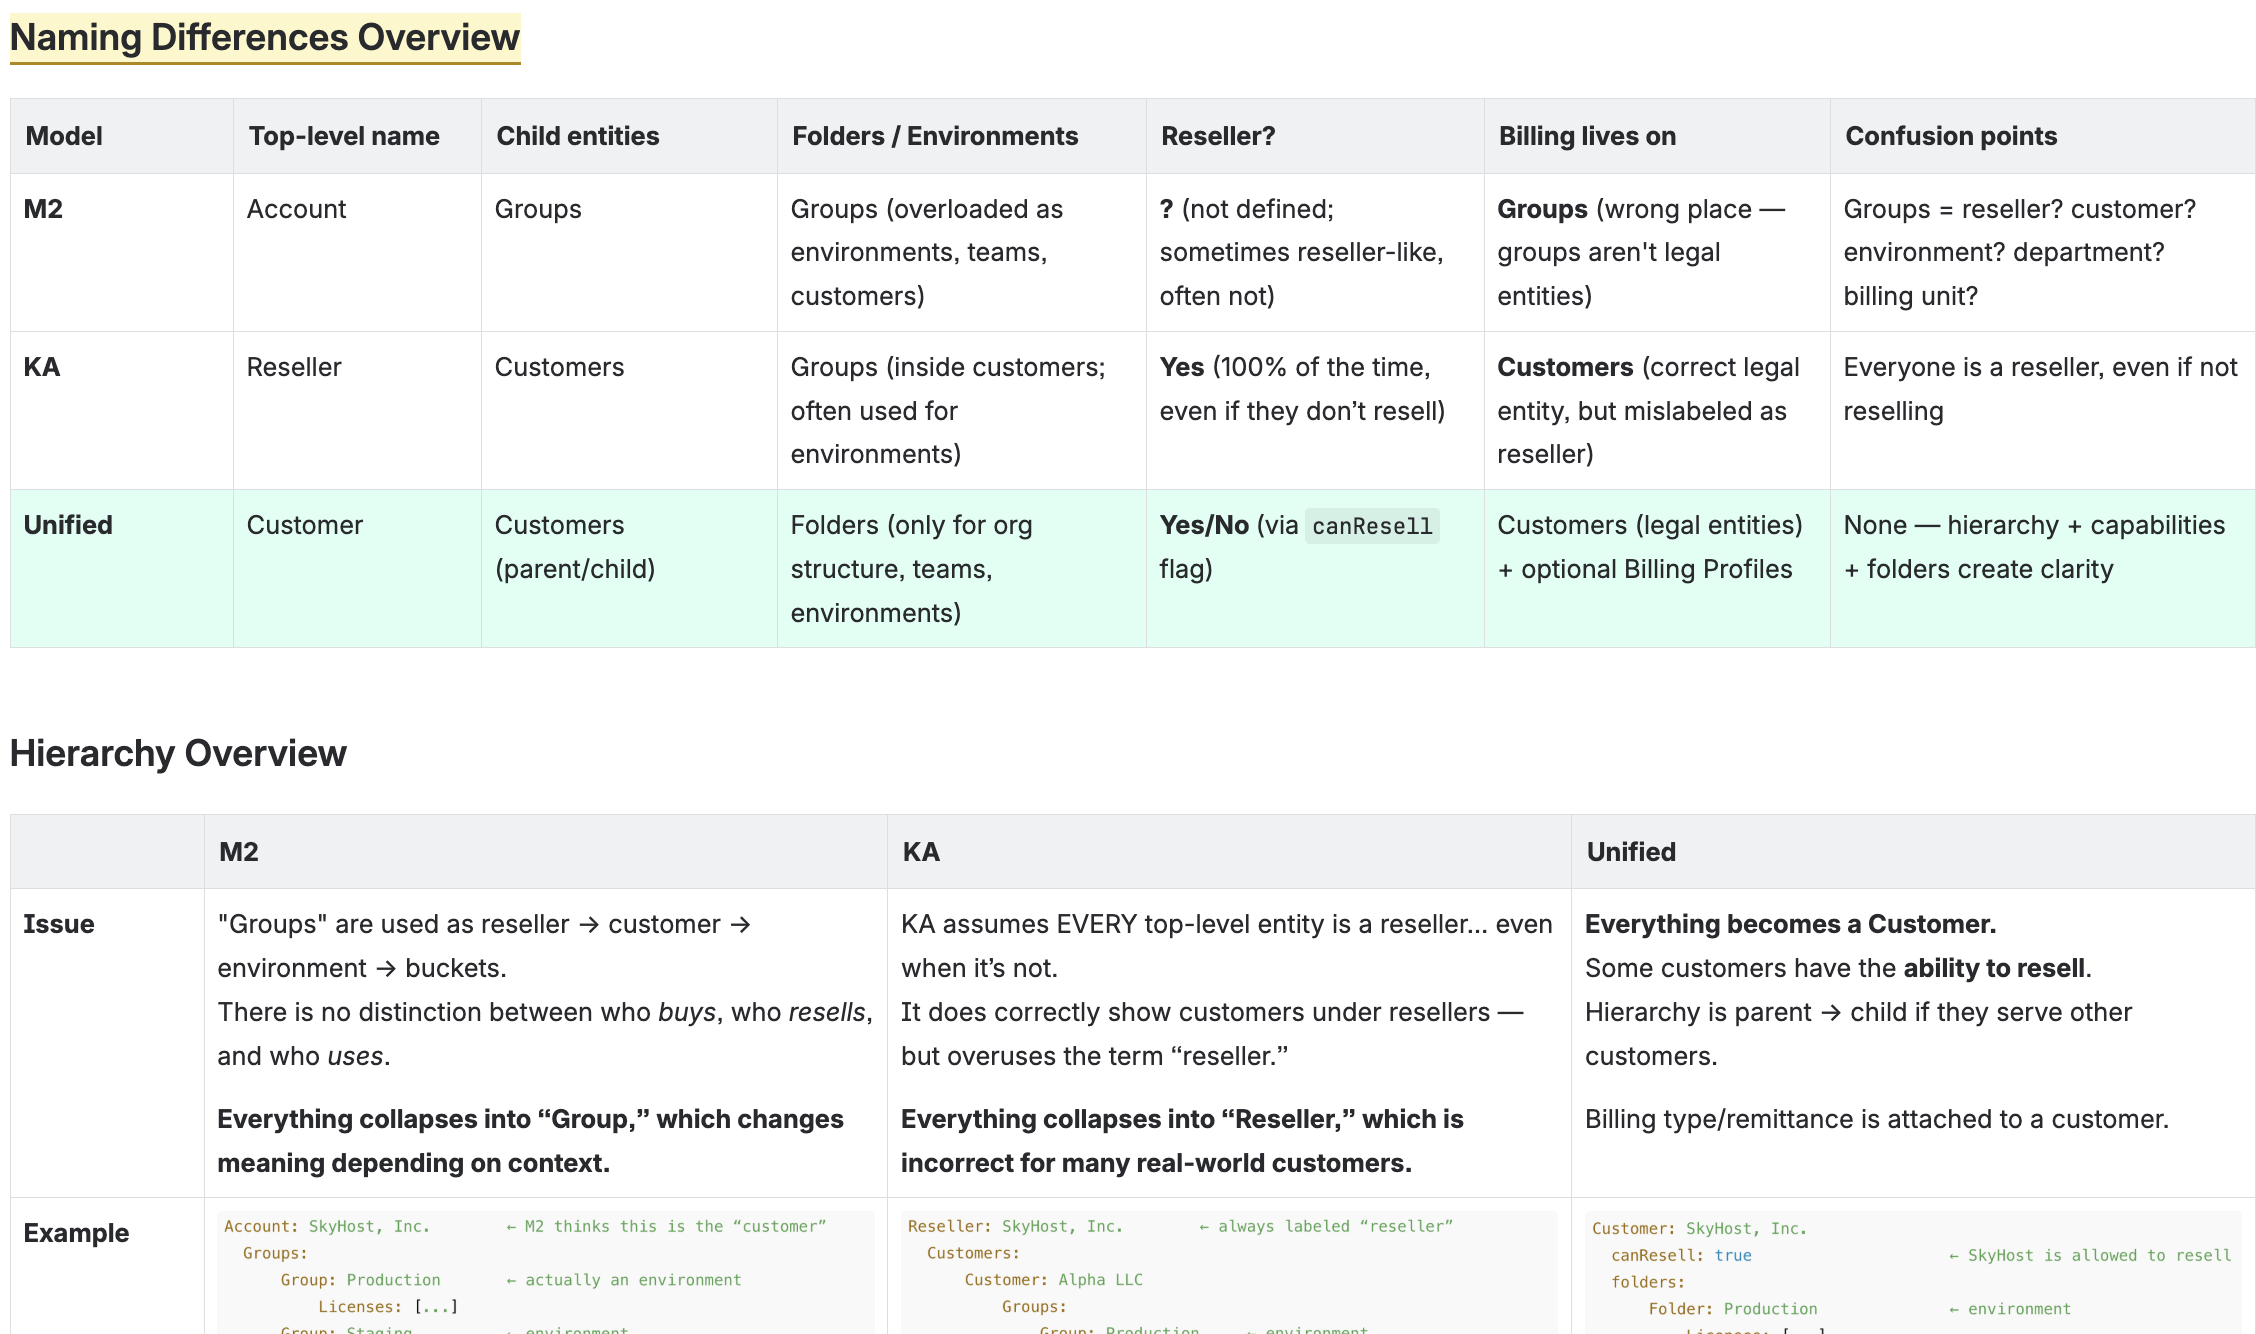
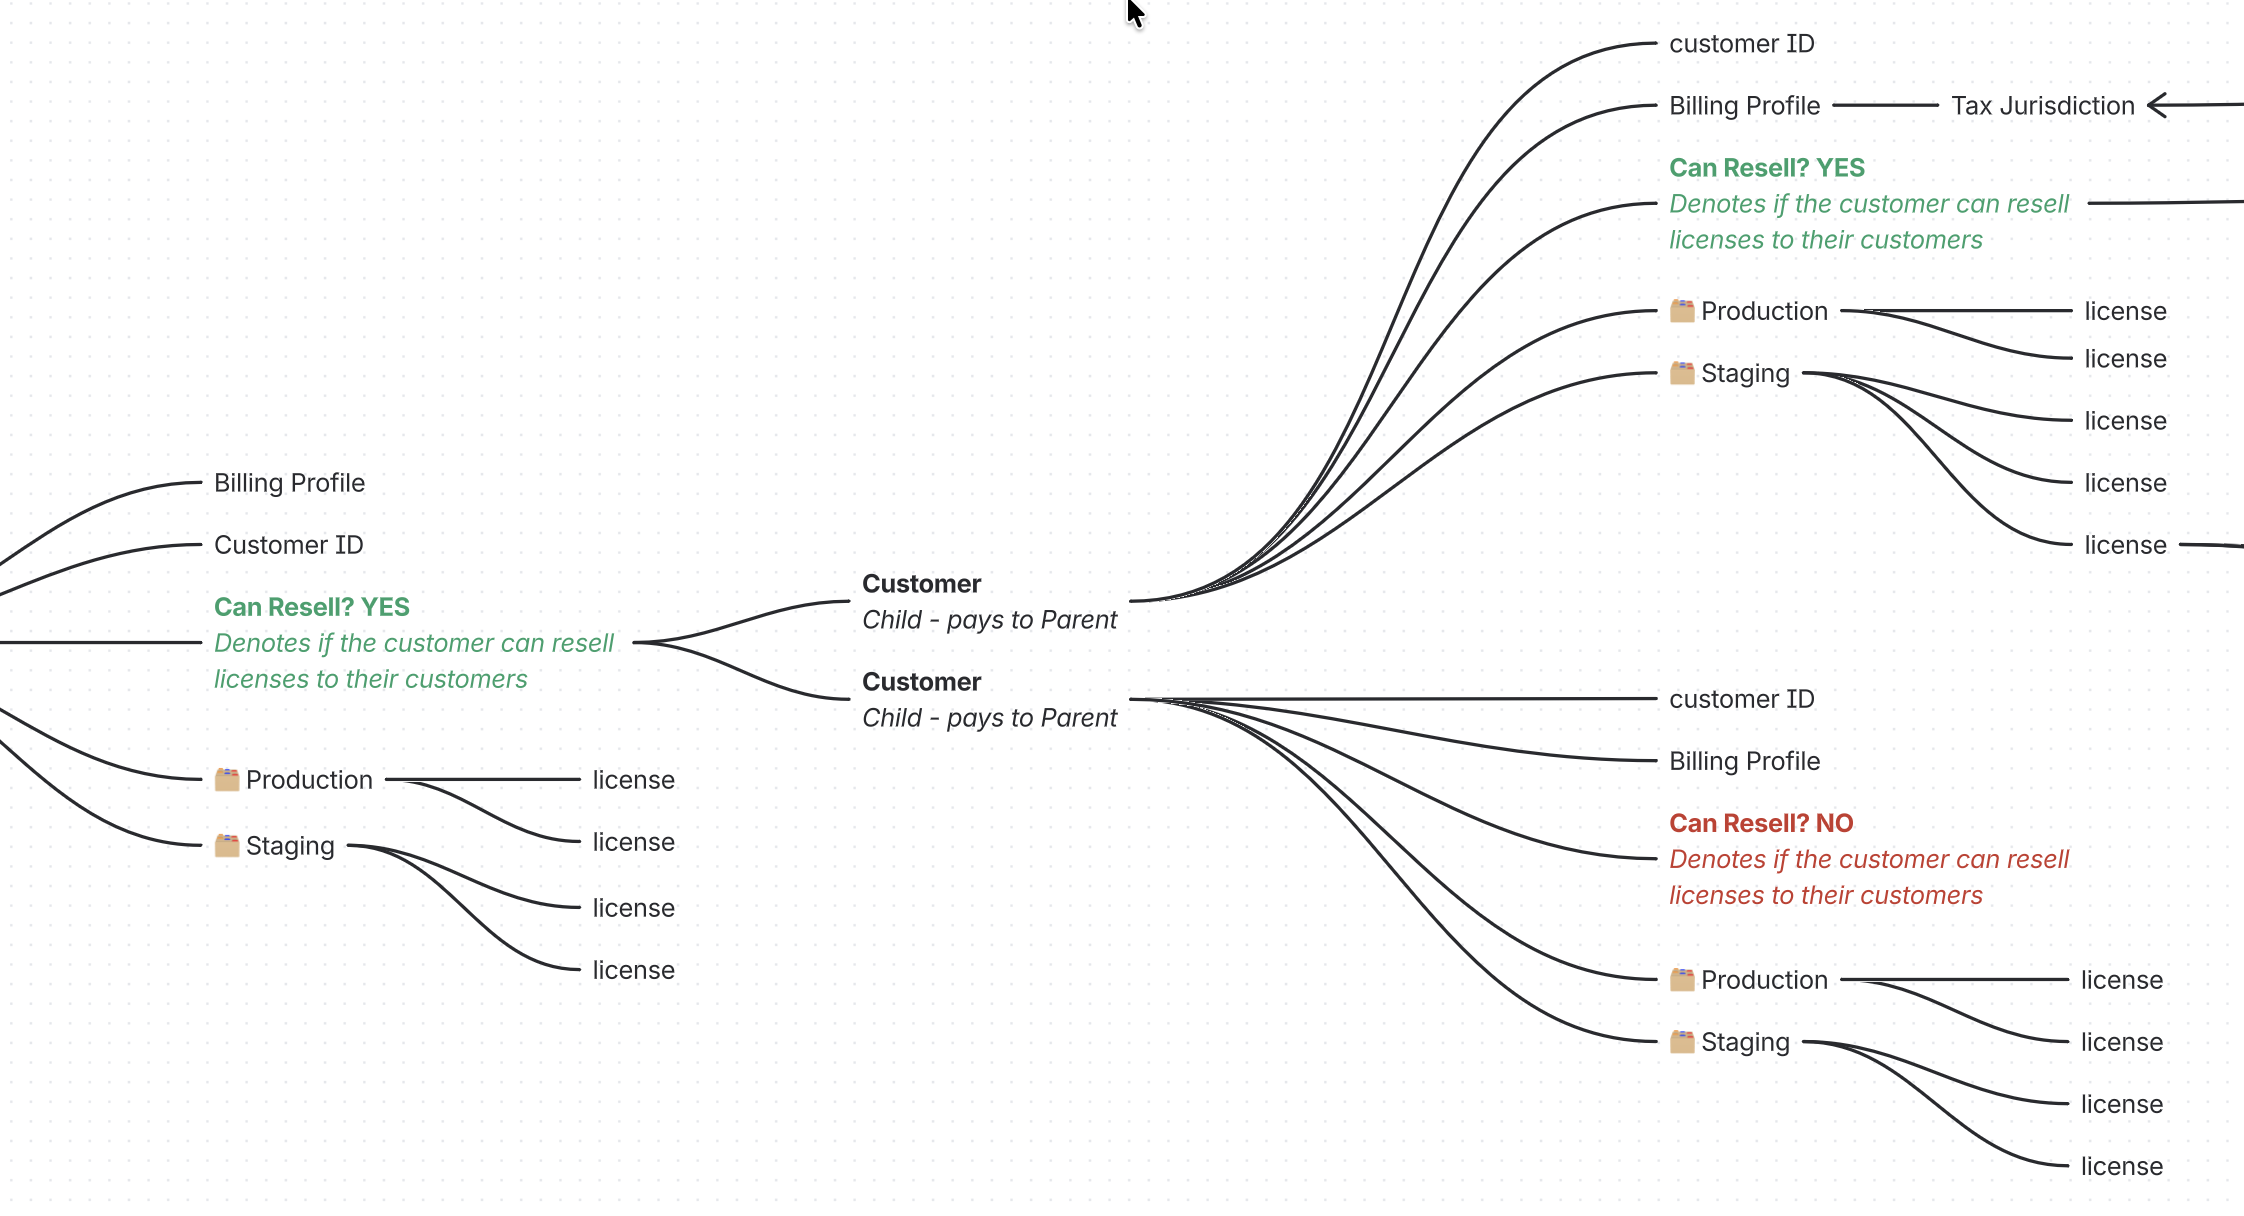
Unified Data Model & Naming
A huge part of making the merge work was getting the data model and naming right so the UI could be coherent. I defined a unified schema of 36 fields, mapping and normalizing legacy fields across M2 and KAPC — from licenseNumber and creationDate through to serverOs, productVersion, and automaticRenewal.
I also resolved conflicting terminology: 'Groups' in M2 versus 'Accounts/Clients' in KA, 'partner' versus 'reseller' versus 'end-customer.' I proposed clearer unified names and hierarchy structures that preserve billing implications while being understandable to partners and internal users. This work gave engineering a clear contract for what the UI needs to display and how to normalize legacy data.
Stakeholder & Partner Research
I personally ran and synthesized multiple rounds of research. CS team interviews revealed pain points around manual renewal control, fragmentation between KA and Partner Central, and lack of payment state visibility. Sales engineer interviews surfaced critical discoverability issues — partners didn't know key features existed, and there was no unified search across systems.
I also drafted structured partner interview guides to understand how partners organize customers (parent/child, prod/test), what identifiers they rely on to start tasks, and their top struggles. These findings directly shaped the Partner Dashboard requirements and prioritization.
Permissions & Feature Mapping
I untangled who can see and do what across all three systems. For every feature — license discovery, billing, reporting, modifications — I documented whether Admins versus Partners can access it, where it exists, and gaps or inconsistencies that needed resolution in the unified dashboard.
This became the groundwork for a clear permissions model and UI states, preventing surprises like features silently disappearing for certain roles or inconsistent capabilities between Admin and Partner views.
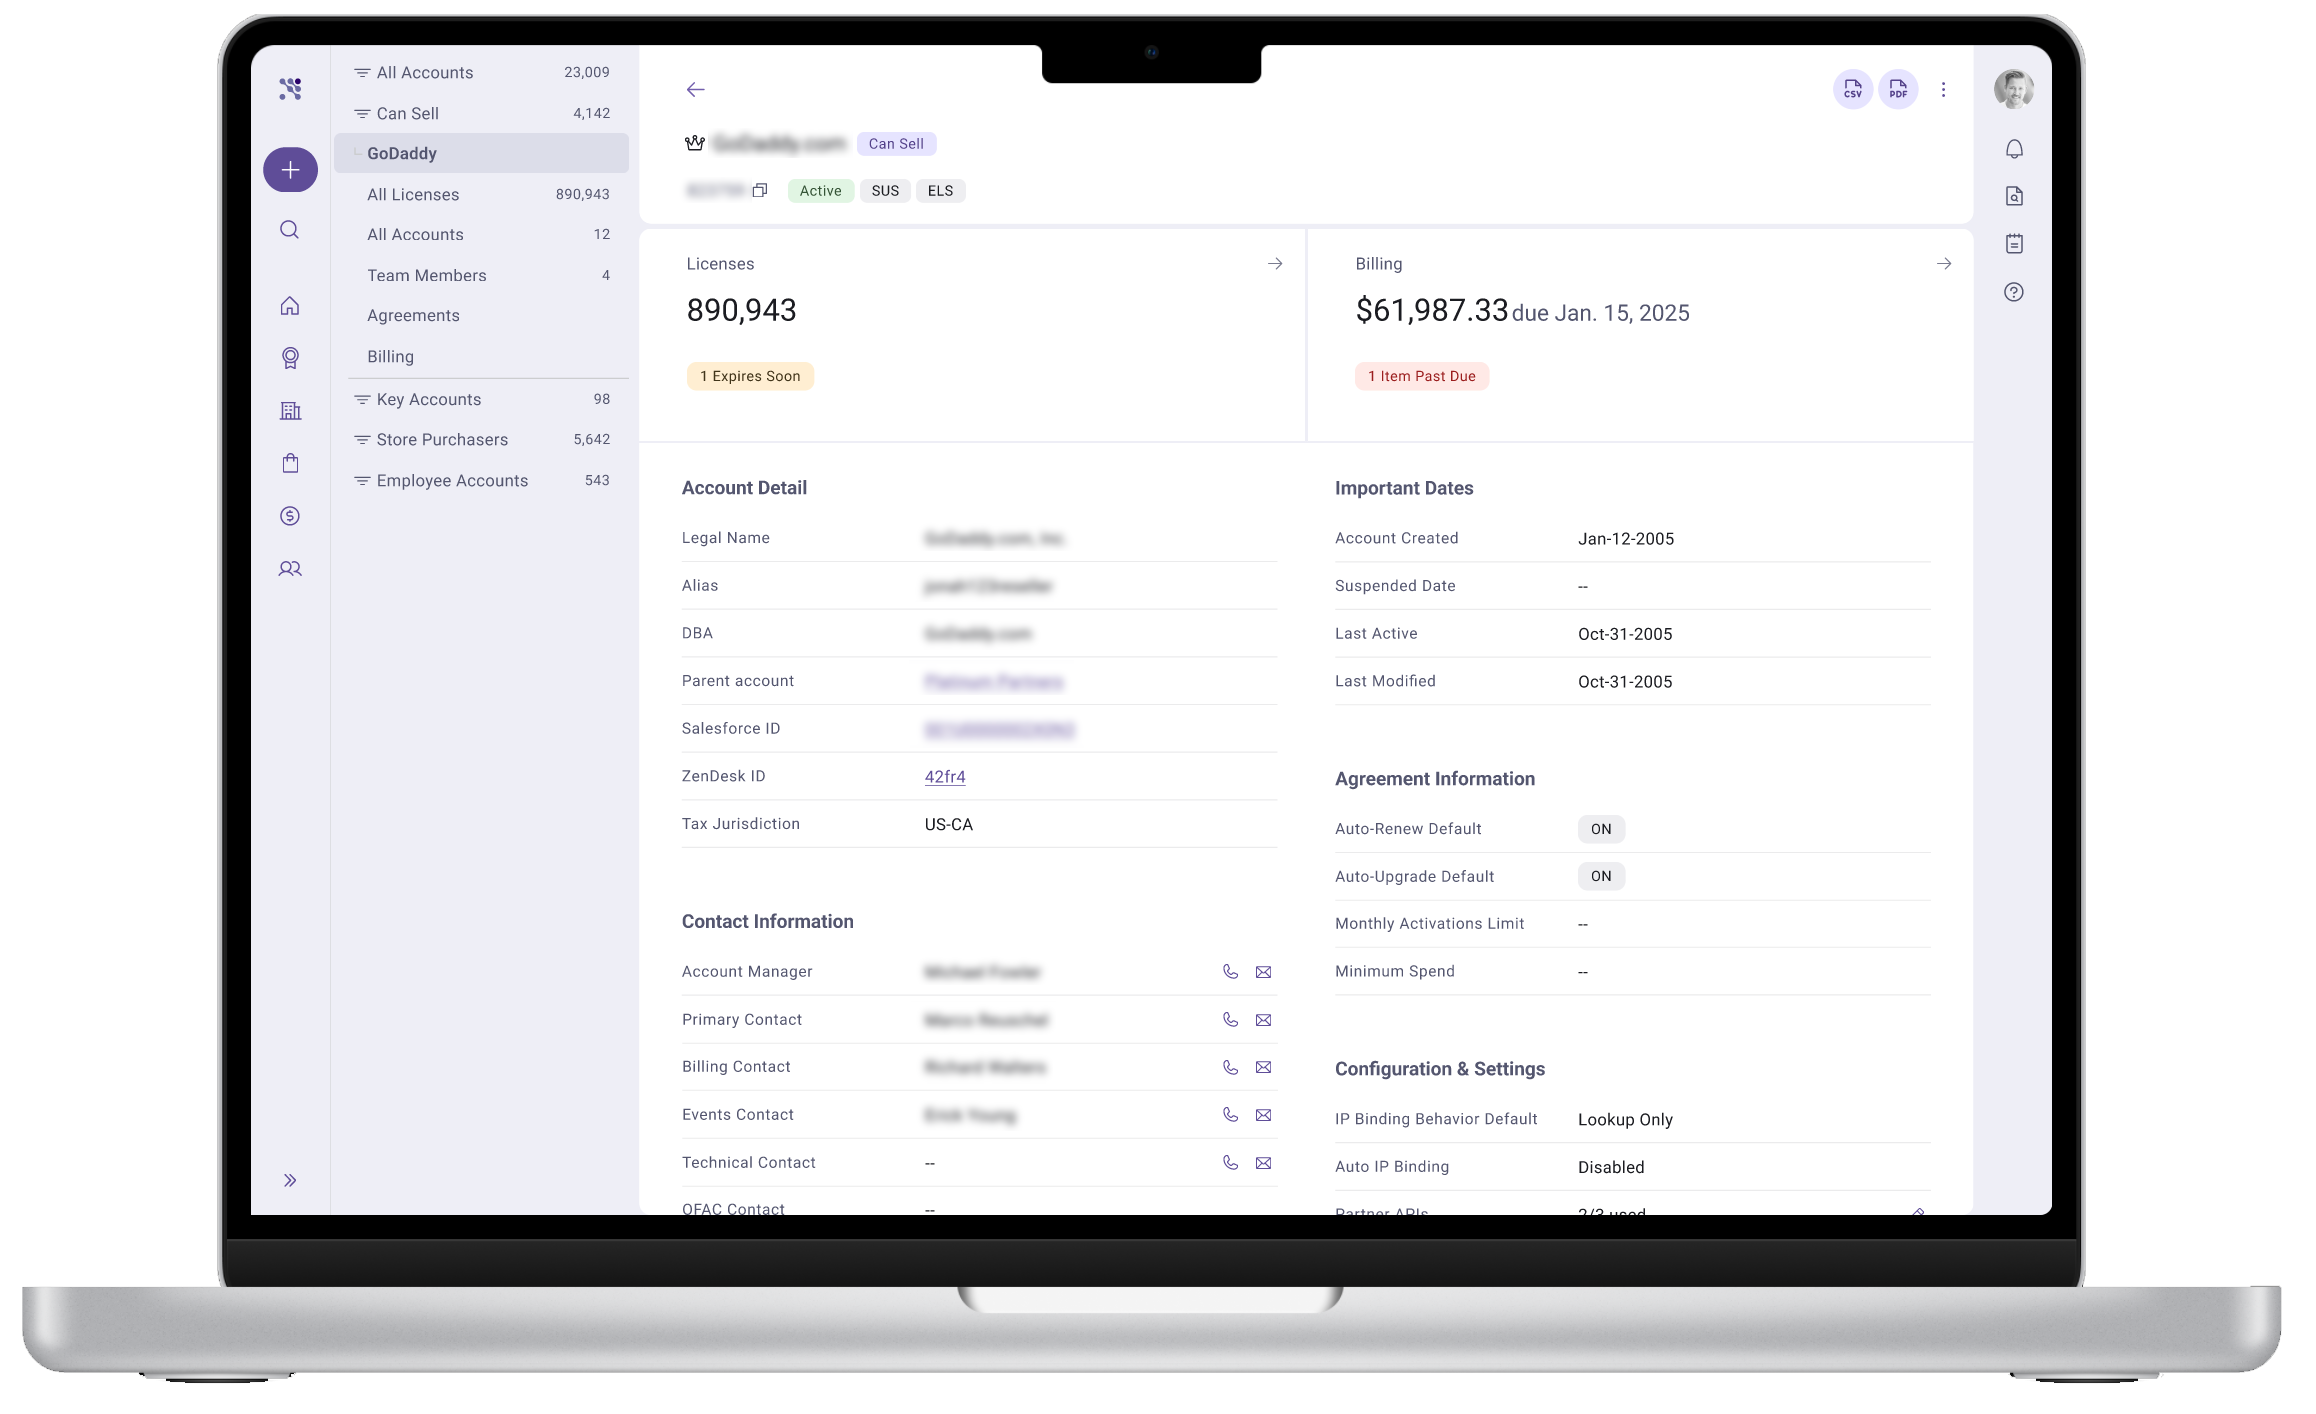
UI Specification & Design Review
With the research and data model in place, I drove UI-level spec and Figma review for the Partner Dashboard screens. I reviewed how account fields are surfaced — partner status chips, suspension indicators, login permissions — calling out what was missing, where fields belong (Account page versus Team Member page), and decisions needed for labels and states.
I ensured the final UI reflects the unified data model correctly rather than copying legacy labels, catching early inconsistencies between existing KA/M2 fields, the Account Overview design, and where permissions actually live.
Outcome
My UX work is the named design component of the Partner Dashboard Project Charter, with deliverables including the unified UI design (milestone: April 2026) and demo dashboard (July 2026). The jobs inventories, data models, naming structures, research synthesis, and permission matrices I created are directly feeding these milestones. Beyond the immediate deliverables, I shaped a strategic vision — including a Partner Risk and Forecasting Console concept — that positions the licensing work within a broader partner experience strategy, giving the organization a roadmap that extends well past feature parity.